Application Statistics
Clicking on the ‘Reports’ menu selection, the ‘Application Statistics’ will display statistics regarding database and ERP transactions.
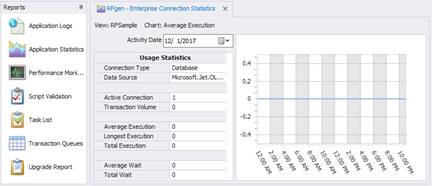
The View menu option selects between each of the configured data connections and the Transaction Management database.
The Chart menu option will show the performance of a given statistic over the course of the day. The options are:
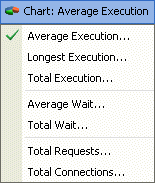
Average Execution is the typical time it takes to execute one call to the specified data connector. The graph shows this average across the whole day. The lower the number, the better. Typical values should be well under one second.
Longest Execution is the longest time RFgen had to wait for one call to the specified data connector. The lower the number, the better. Typical values should be well under one second.
Total Execution is an accumulated amount of time that RFgen has spent waiting for all executed calls to the specified data connector.
Average Wait refers to how long on average a user must wait for RFgen to provide them a connection to the specified data connector using the Connection Pooling process. Typical values should be less than one second. If the user must wait longer, then the connection pool should be increased.
Total Wait is an accumulated amount of time that users have spent waiting for RFgen to assign a data connection handle from the pool.
Total requests is the total number of times RFgen access the specified data connector for any reason.
Total Connections is the number of currently open connections to this data connector. Without Connection Pooling, each logged in user will have their own connection. With Connection Pooling enabled, the maximum should be the limit placed on the pool in the configuration and the minimum should be one.
To enable the Statistics, choose the Configuration / Performance Monitoring menu option, select the Record Usage option and change the value from Disabled to some increment for refreshing the data.